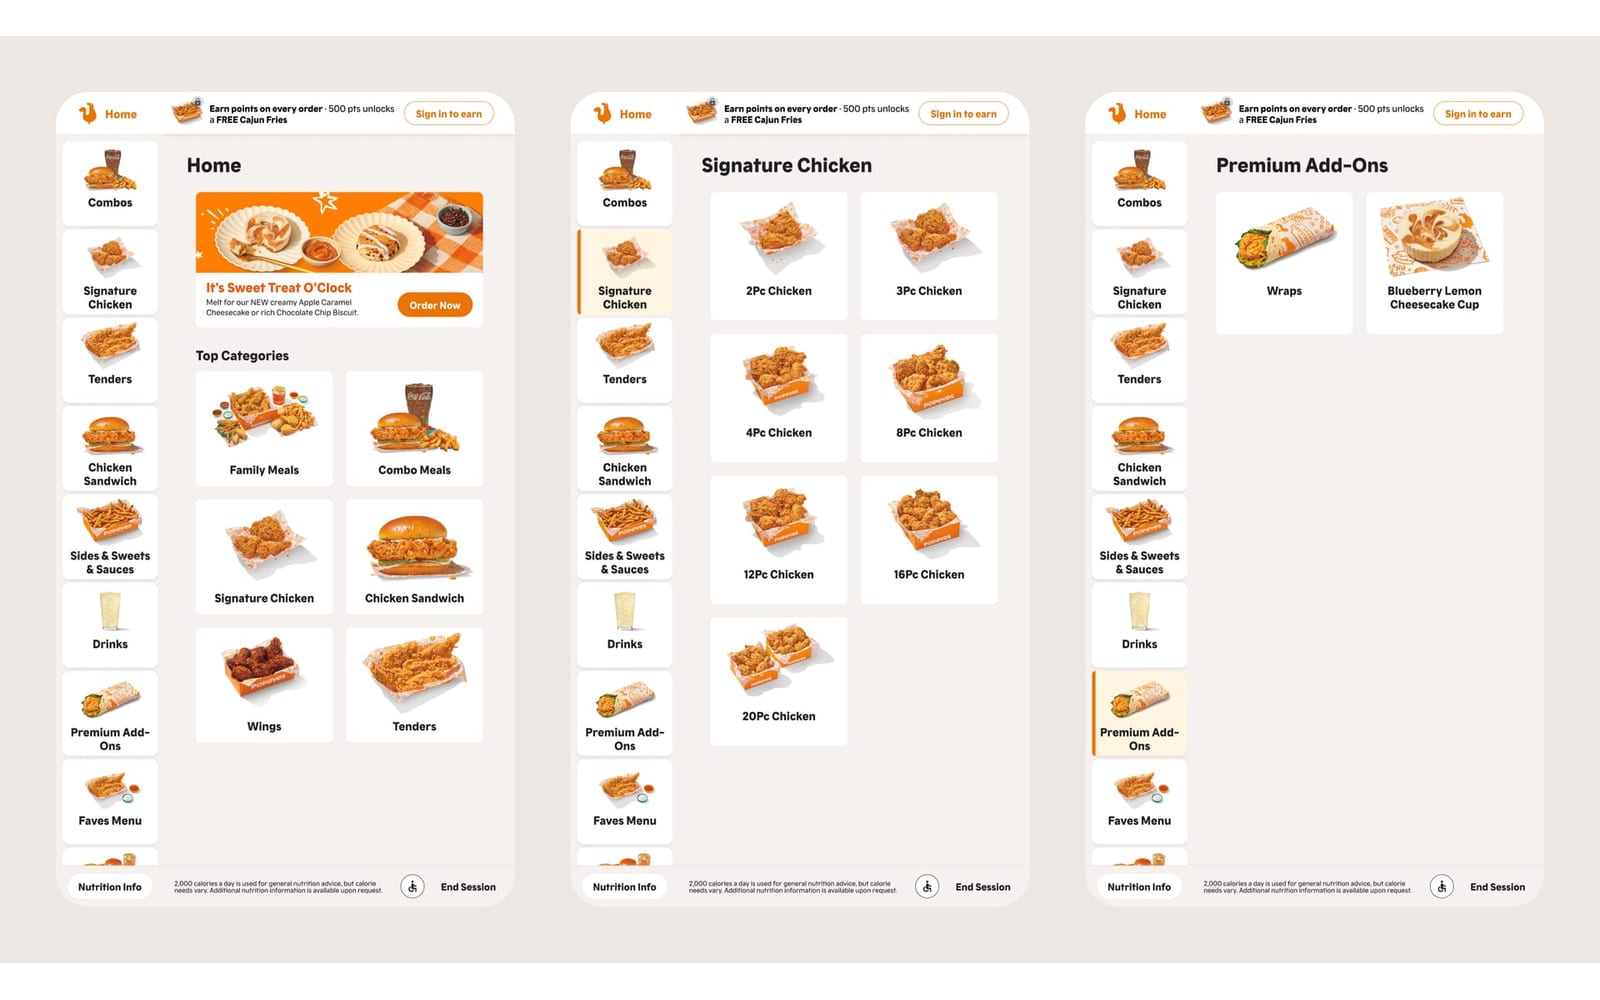
the problem
We needed to know which mix of price display, bag design and badges helped guests at checkout.
Two rounds of factorial usability testing that shaped a better checkout, plus a code-first research setup that stopped broken prototypes from losing data.
We needed to know which mix of price display, bag design and badges helped guests at checkout.
Two factorial studies, 96 sessions, and one coded prototype with 8 variants in place of six Figma files.
The most common complaint went to zero in 55 sessions, and clear rules went into the checkout.
We needed to know which mix of price display, bag design and badges helped guests at checkout, and which got in their way.
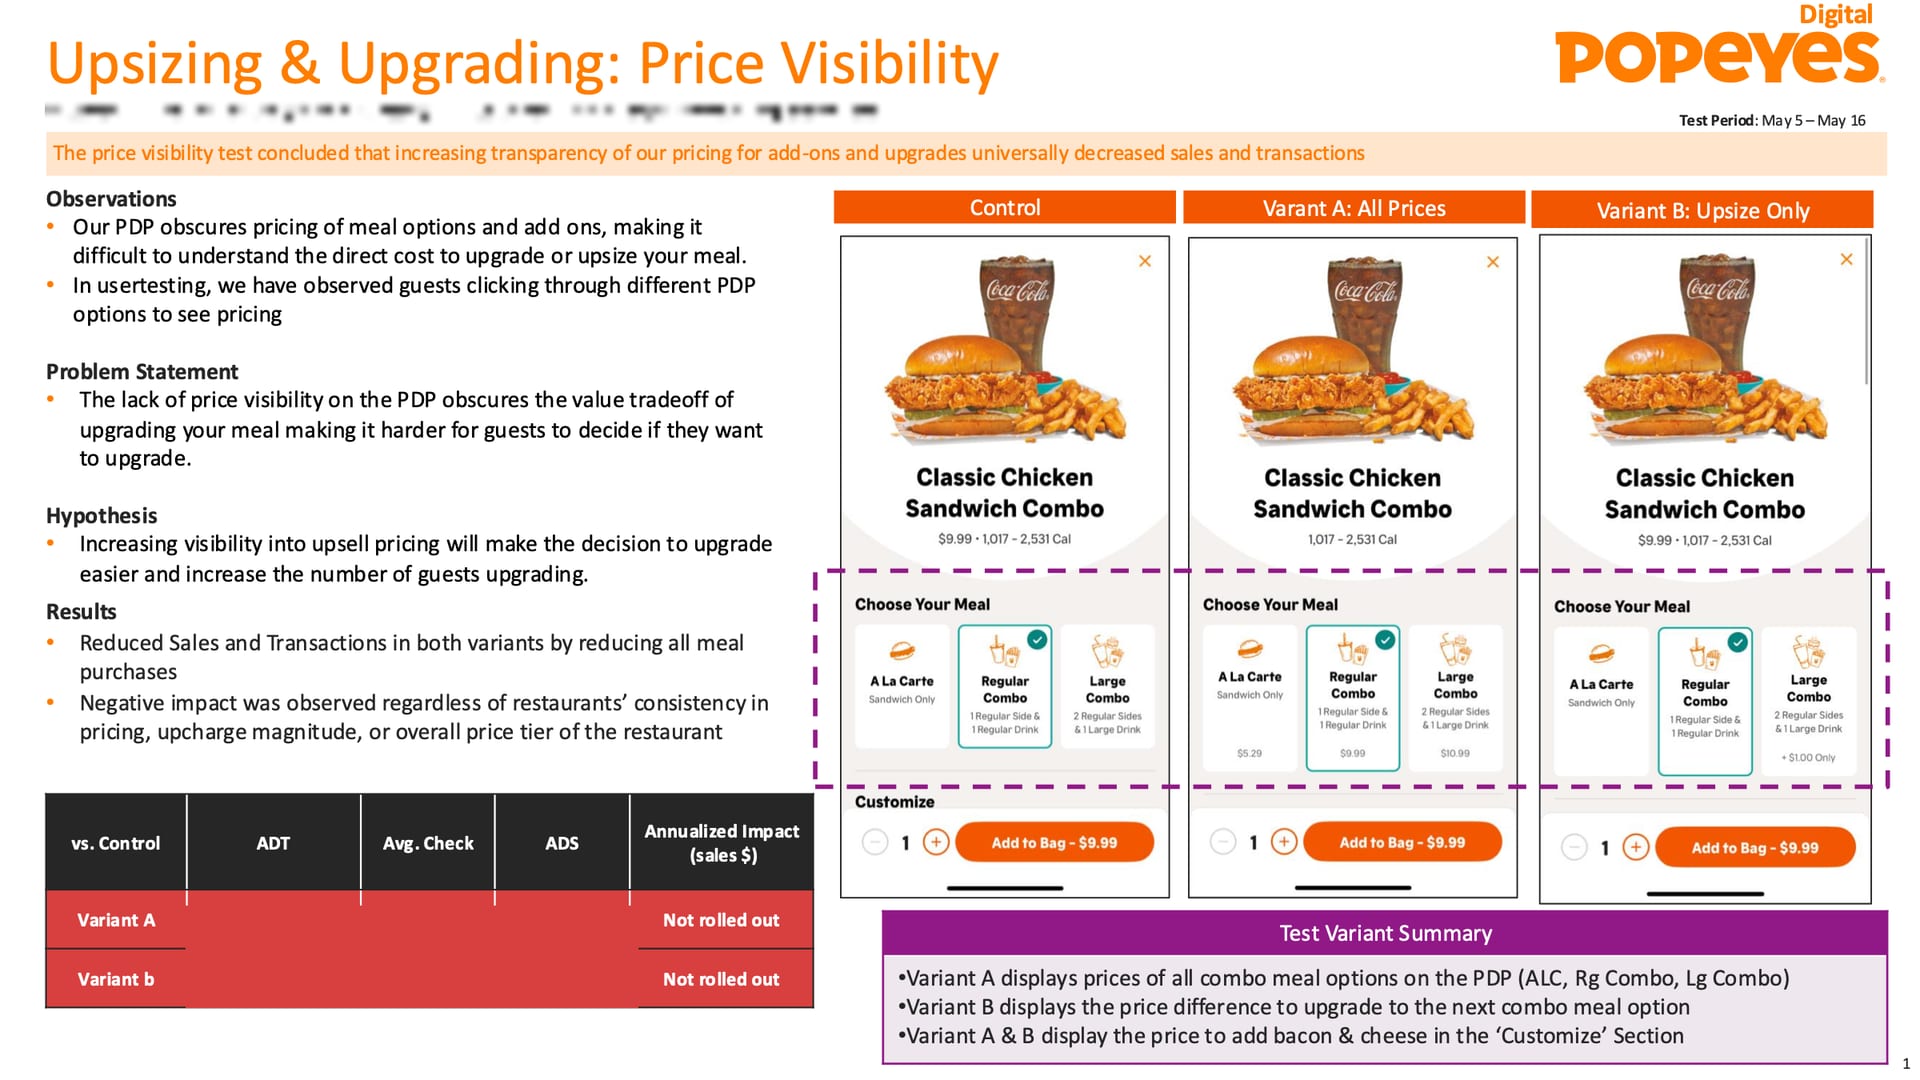
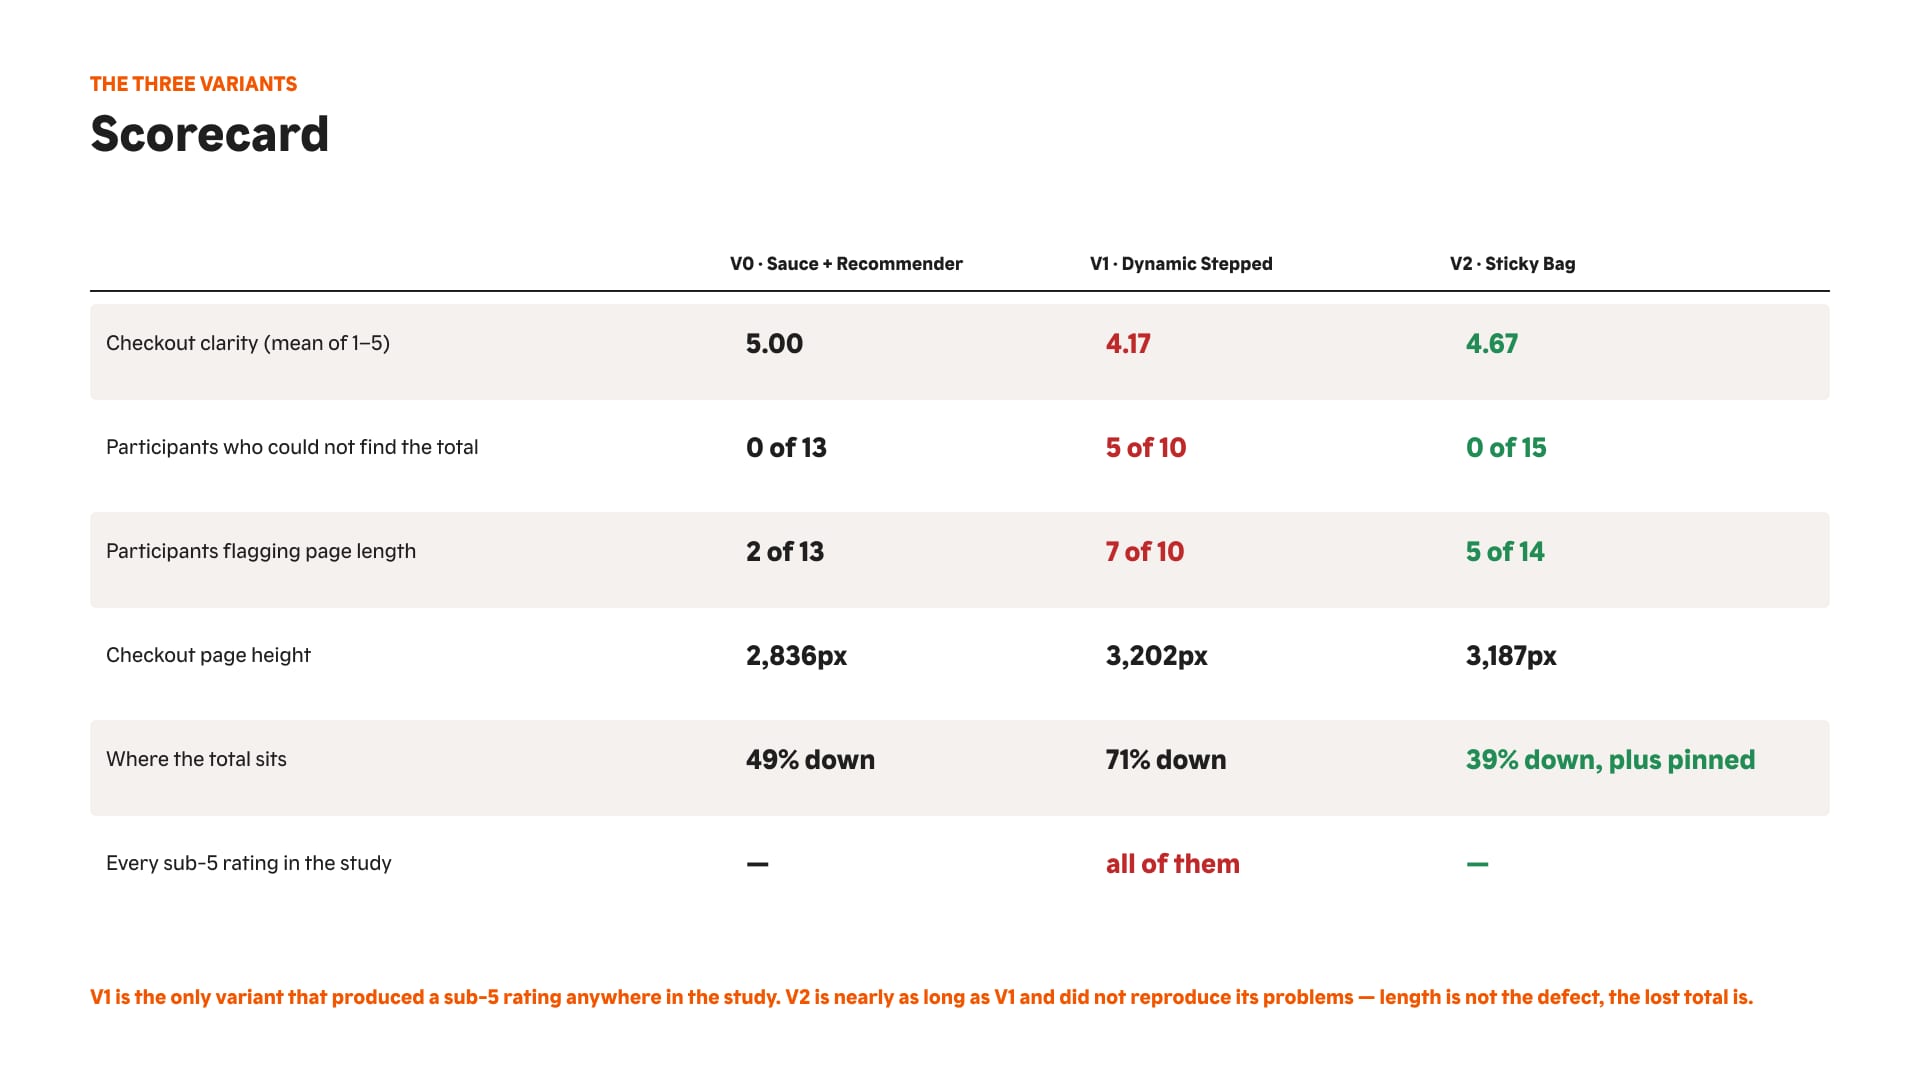
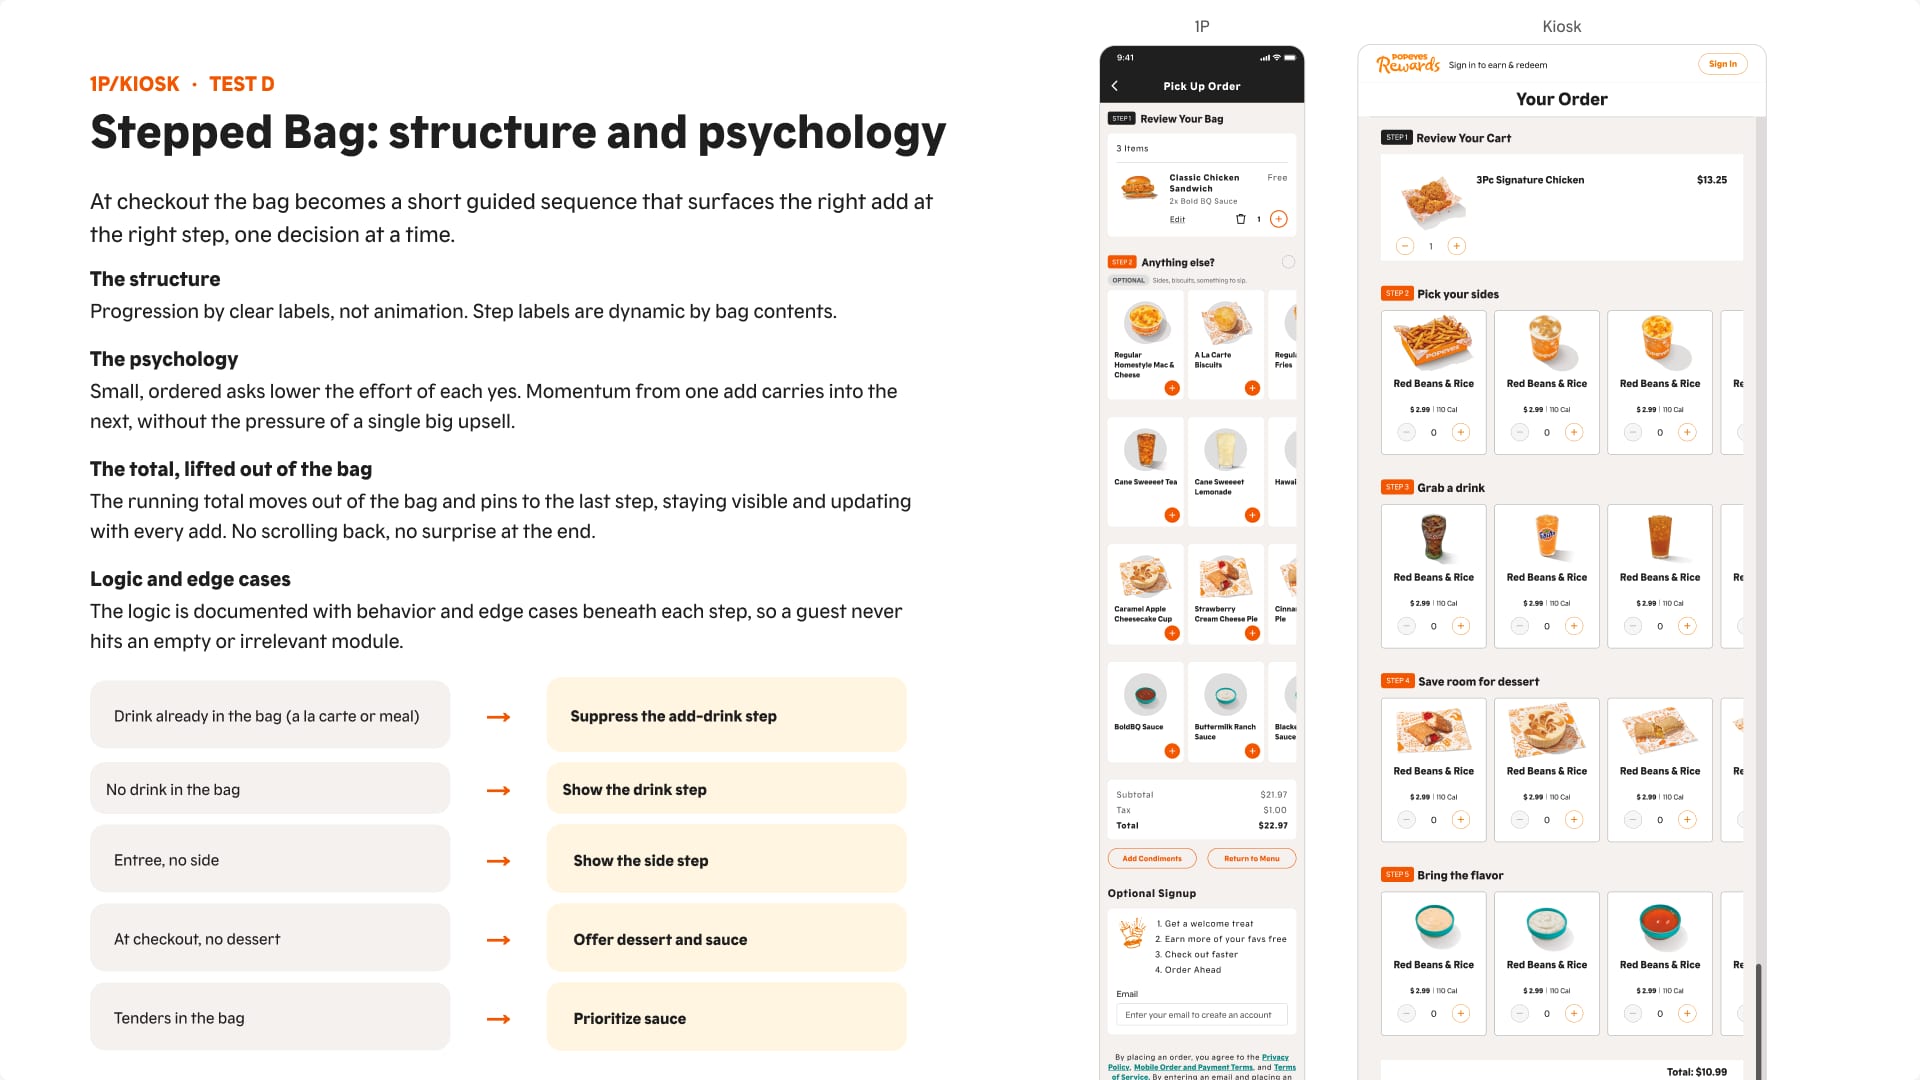
A 2 × 3 design, 40 unmoderated sessions. A stepped checkout buried the cart total: half the people in that version couldn’t find it, and nobody had that problem in the others. A sticky running total fixed it.
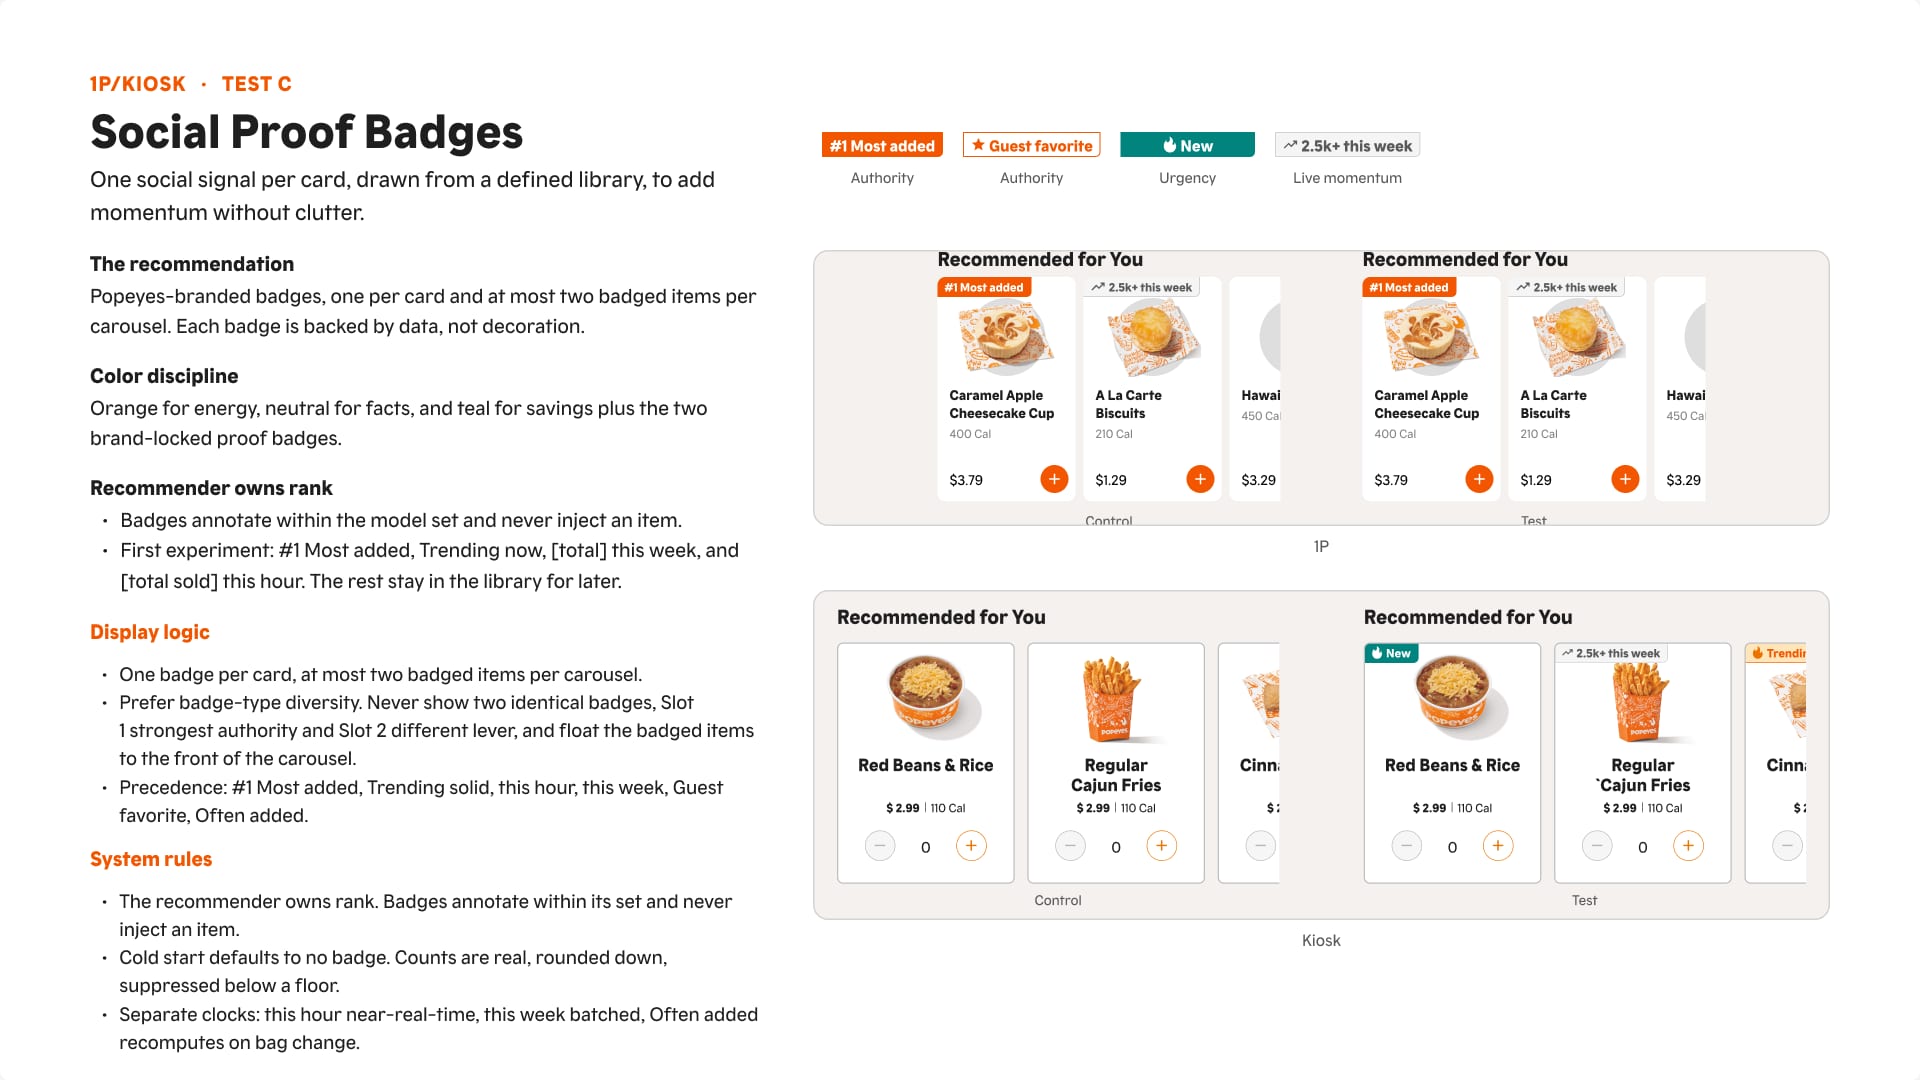
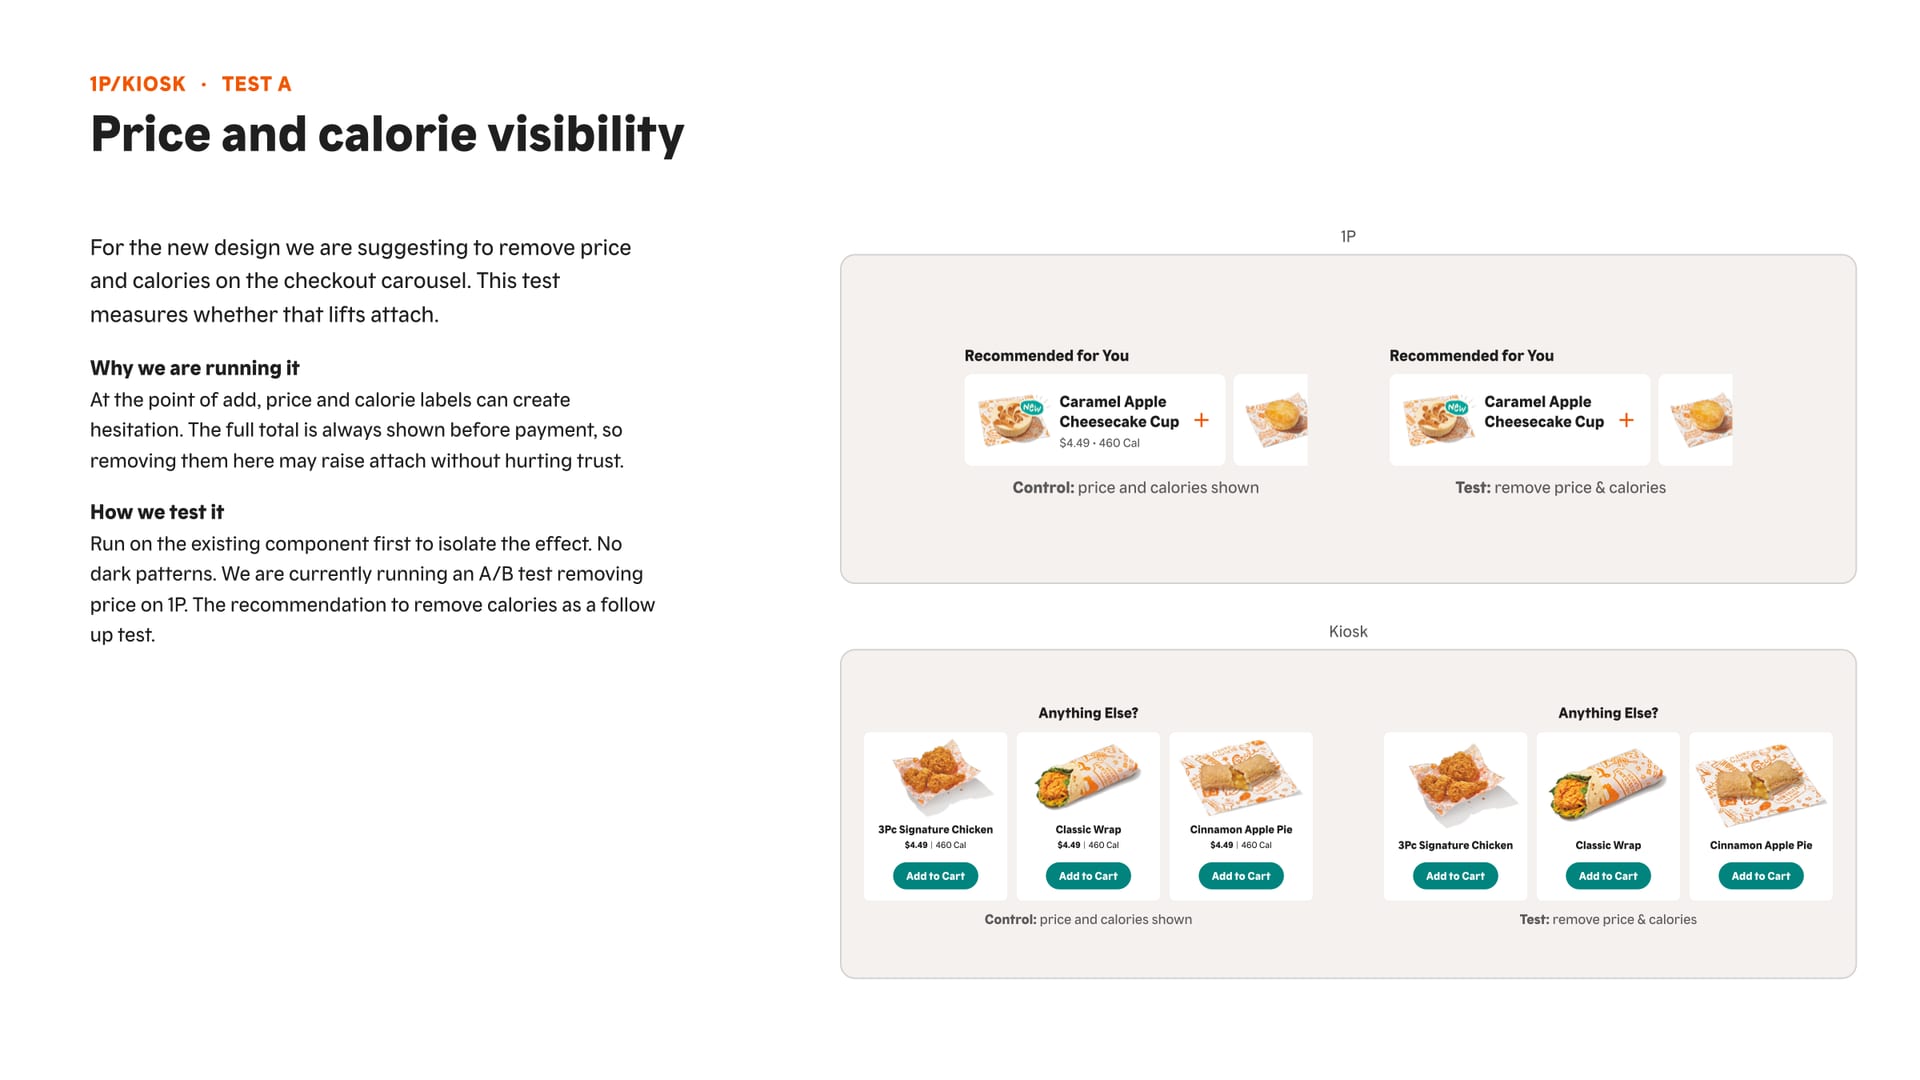
A 2 × 2 × 2 design (price, sticky bag, badges), 56 sessions, with screener quotas based on real order demographics.
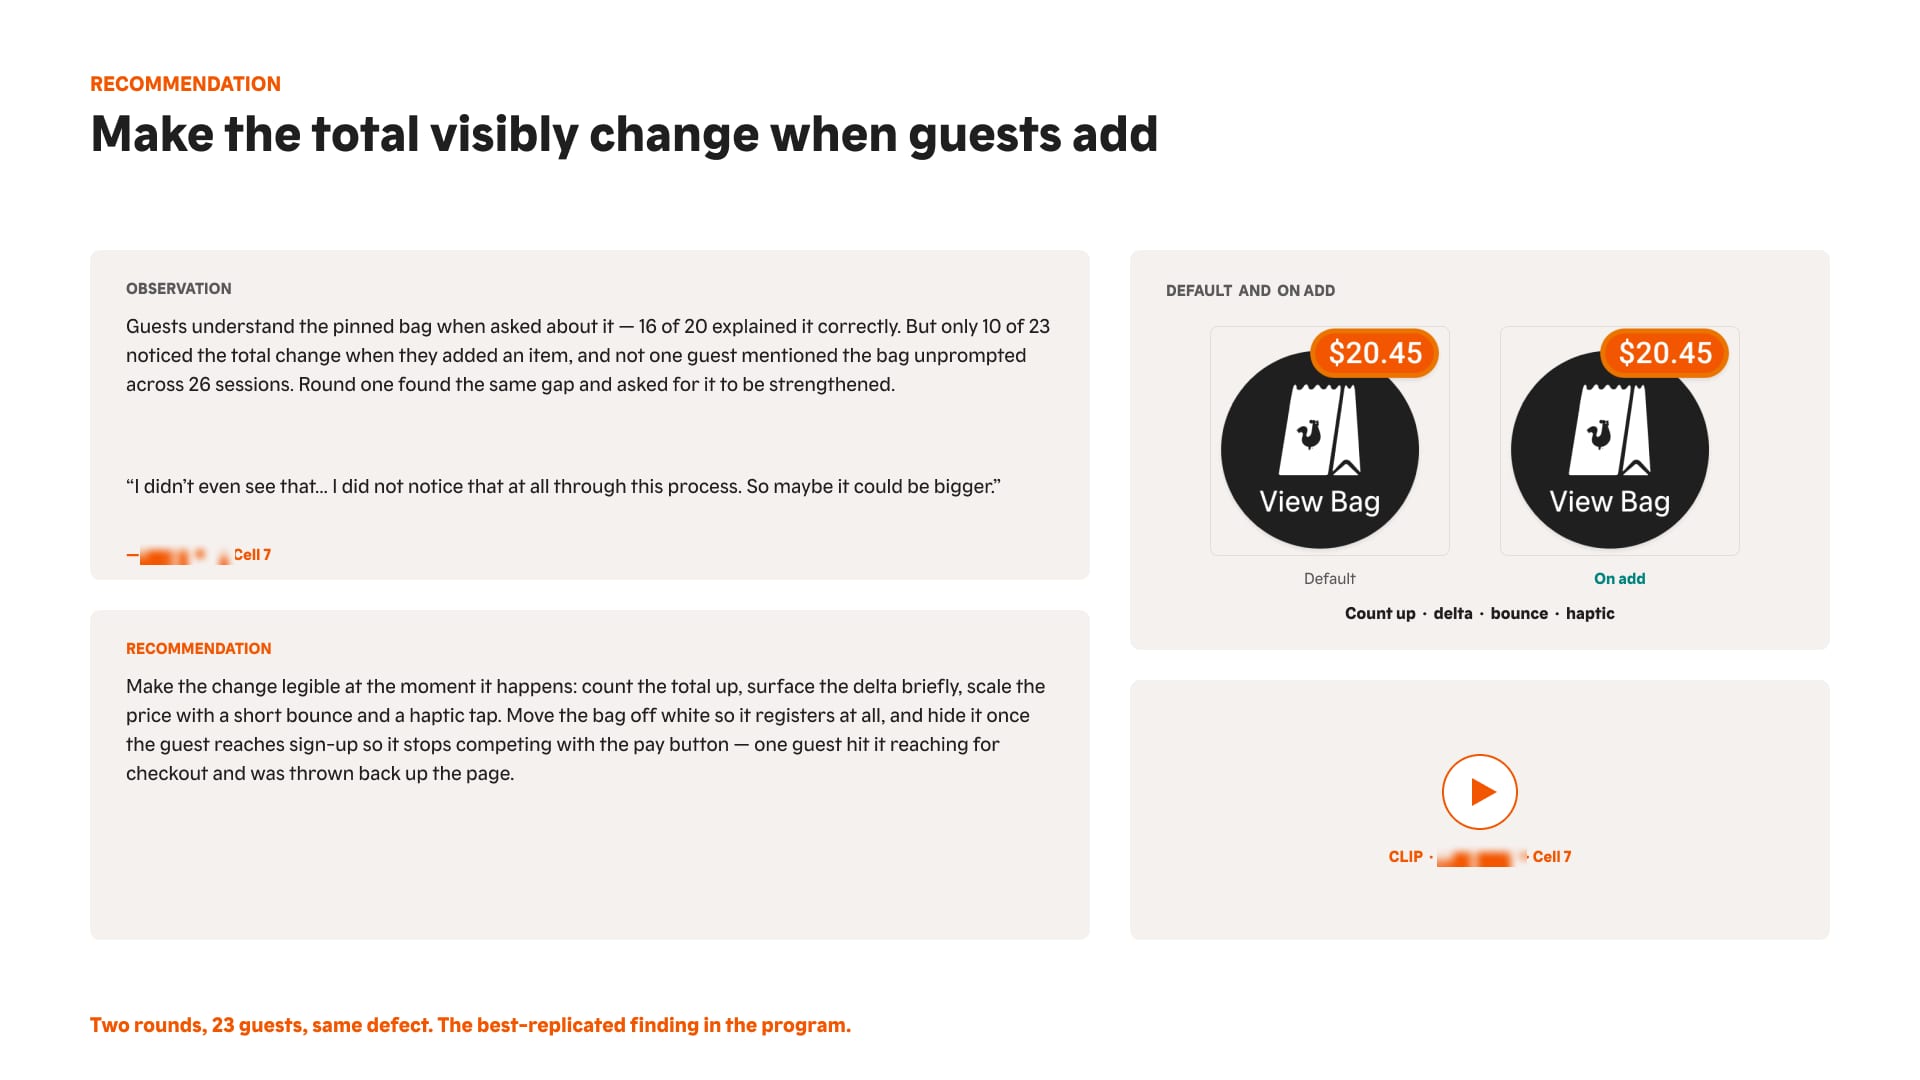
Upsell items filtered by what’s already in the cart.
At most 3 carousels, sauces first, never re-show what’s already in the bag, always show price and calories.
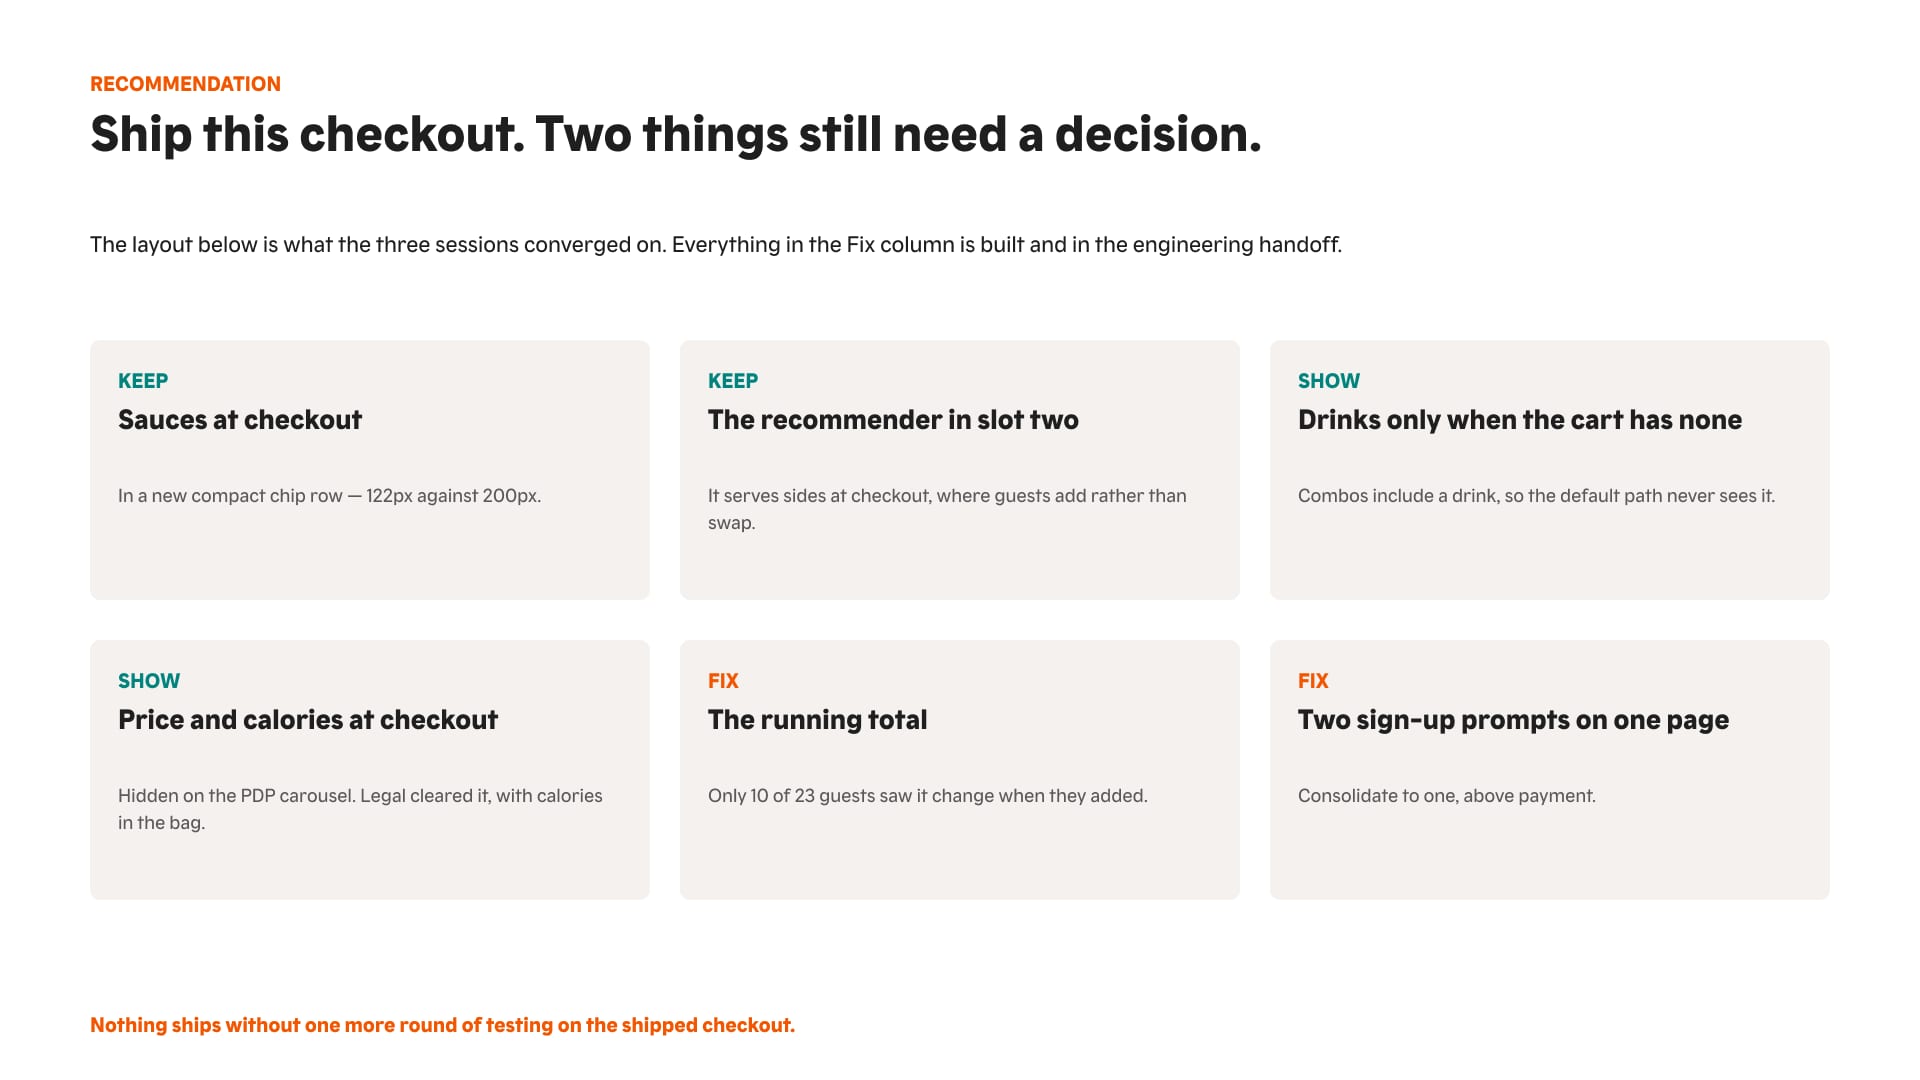
Filtering by what’s in the cart took the most common complaint from frequent to zero in 55 sessions. Every state, flow and new component went to engineering on one page.
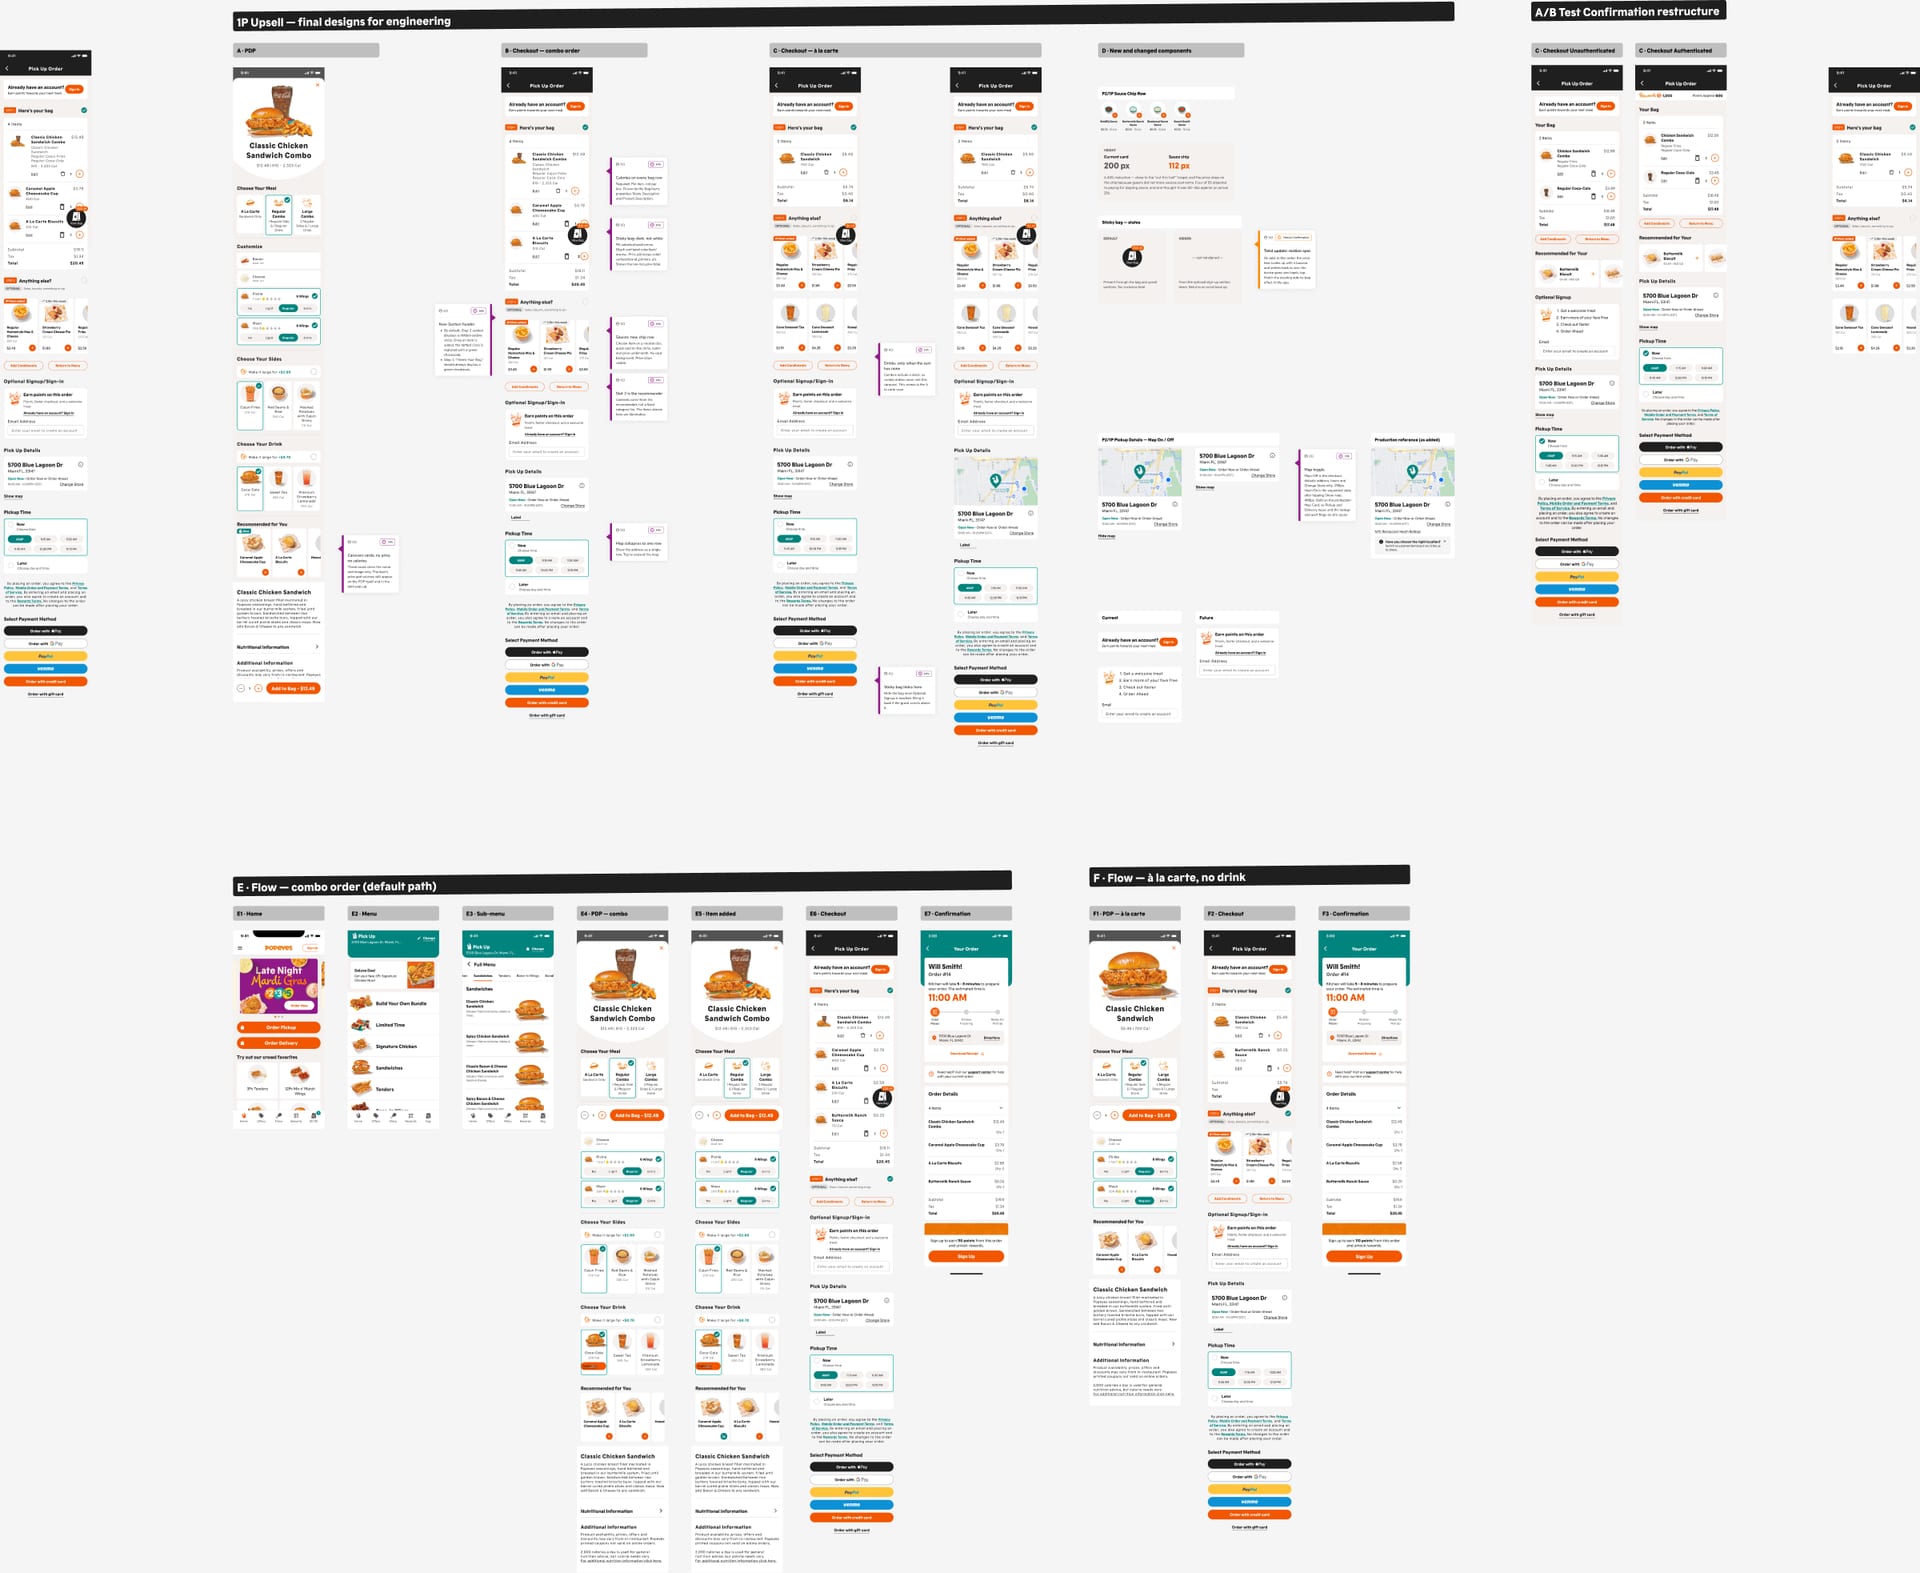
Broken prototype links had cost us data in round 1. For round 2, I replaced six hand-built Figma prototypes with one coded prototype that switches between 8 variants from the URL.
Scroll sideways for the screens that didn’t fit the story.
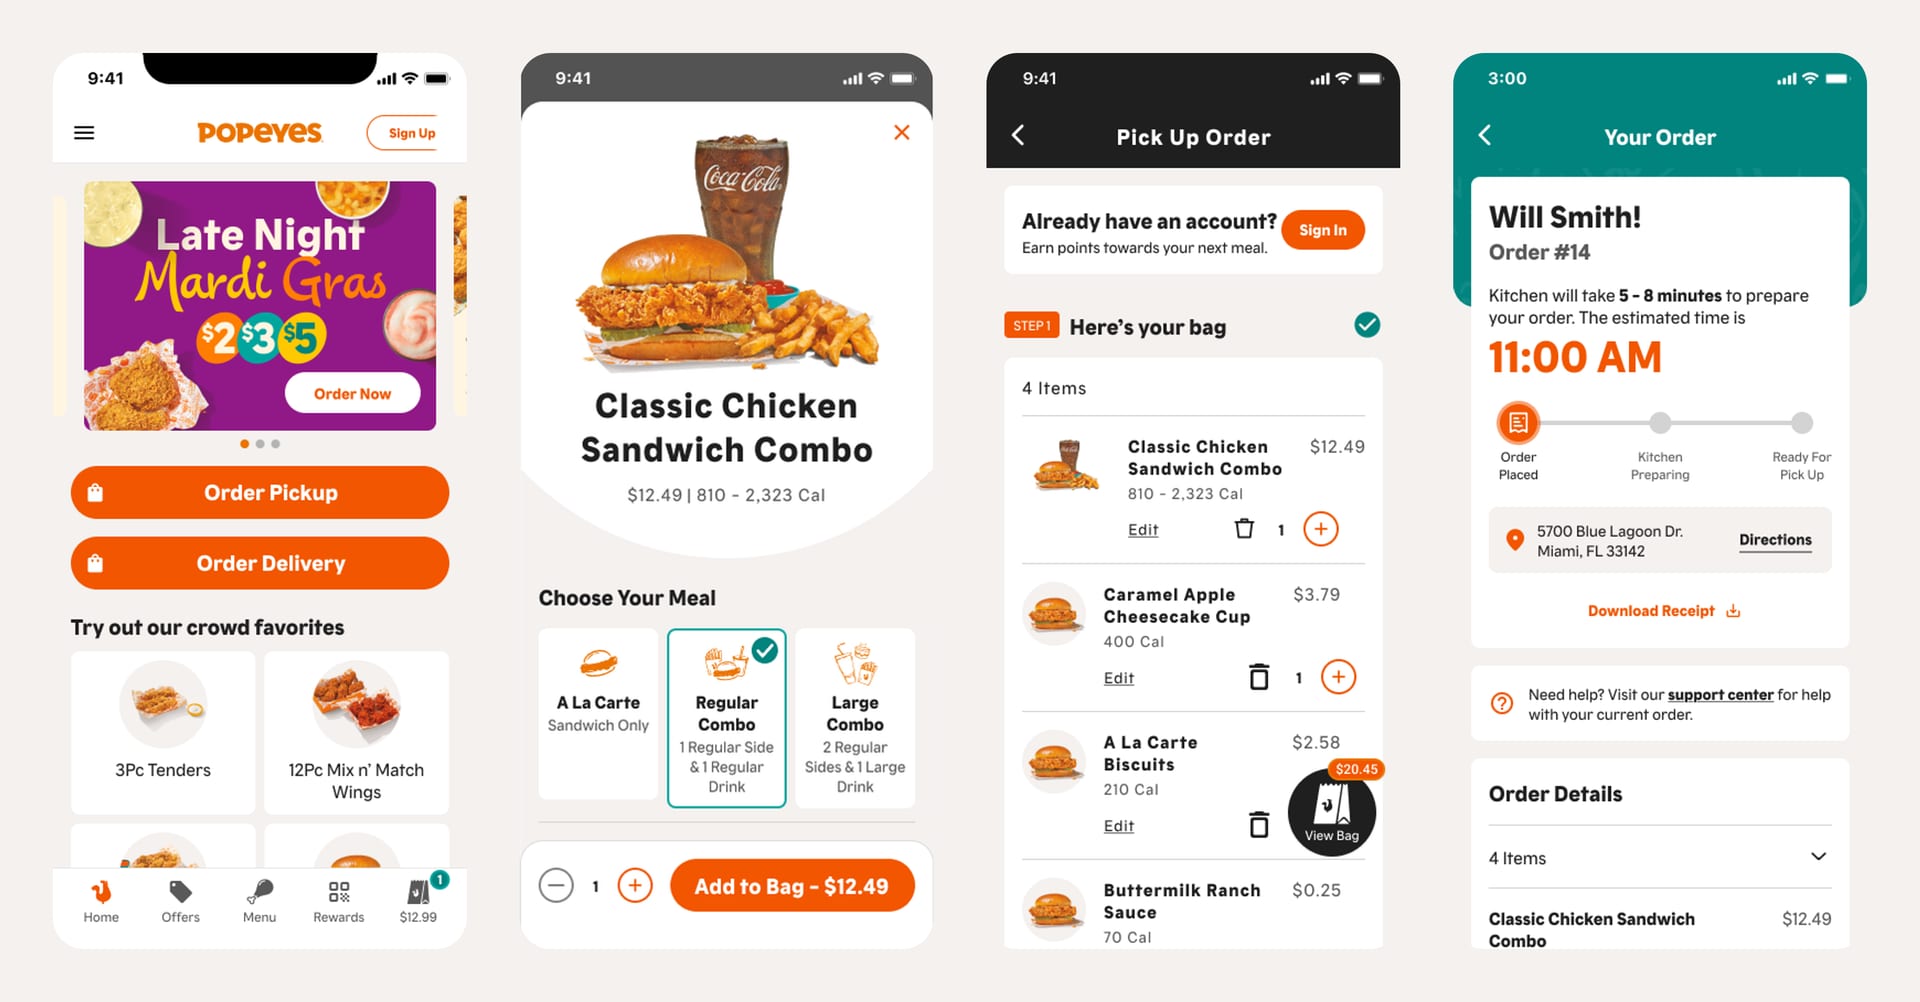
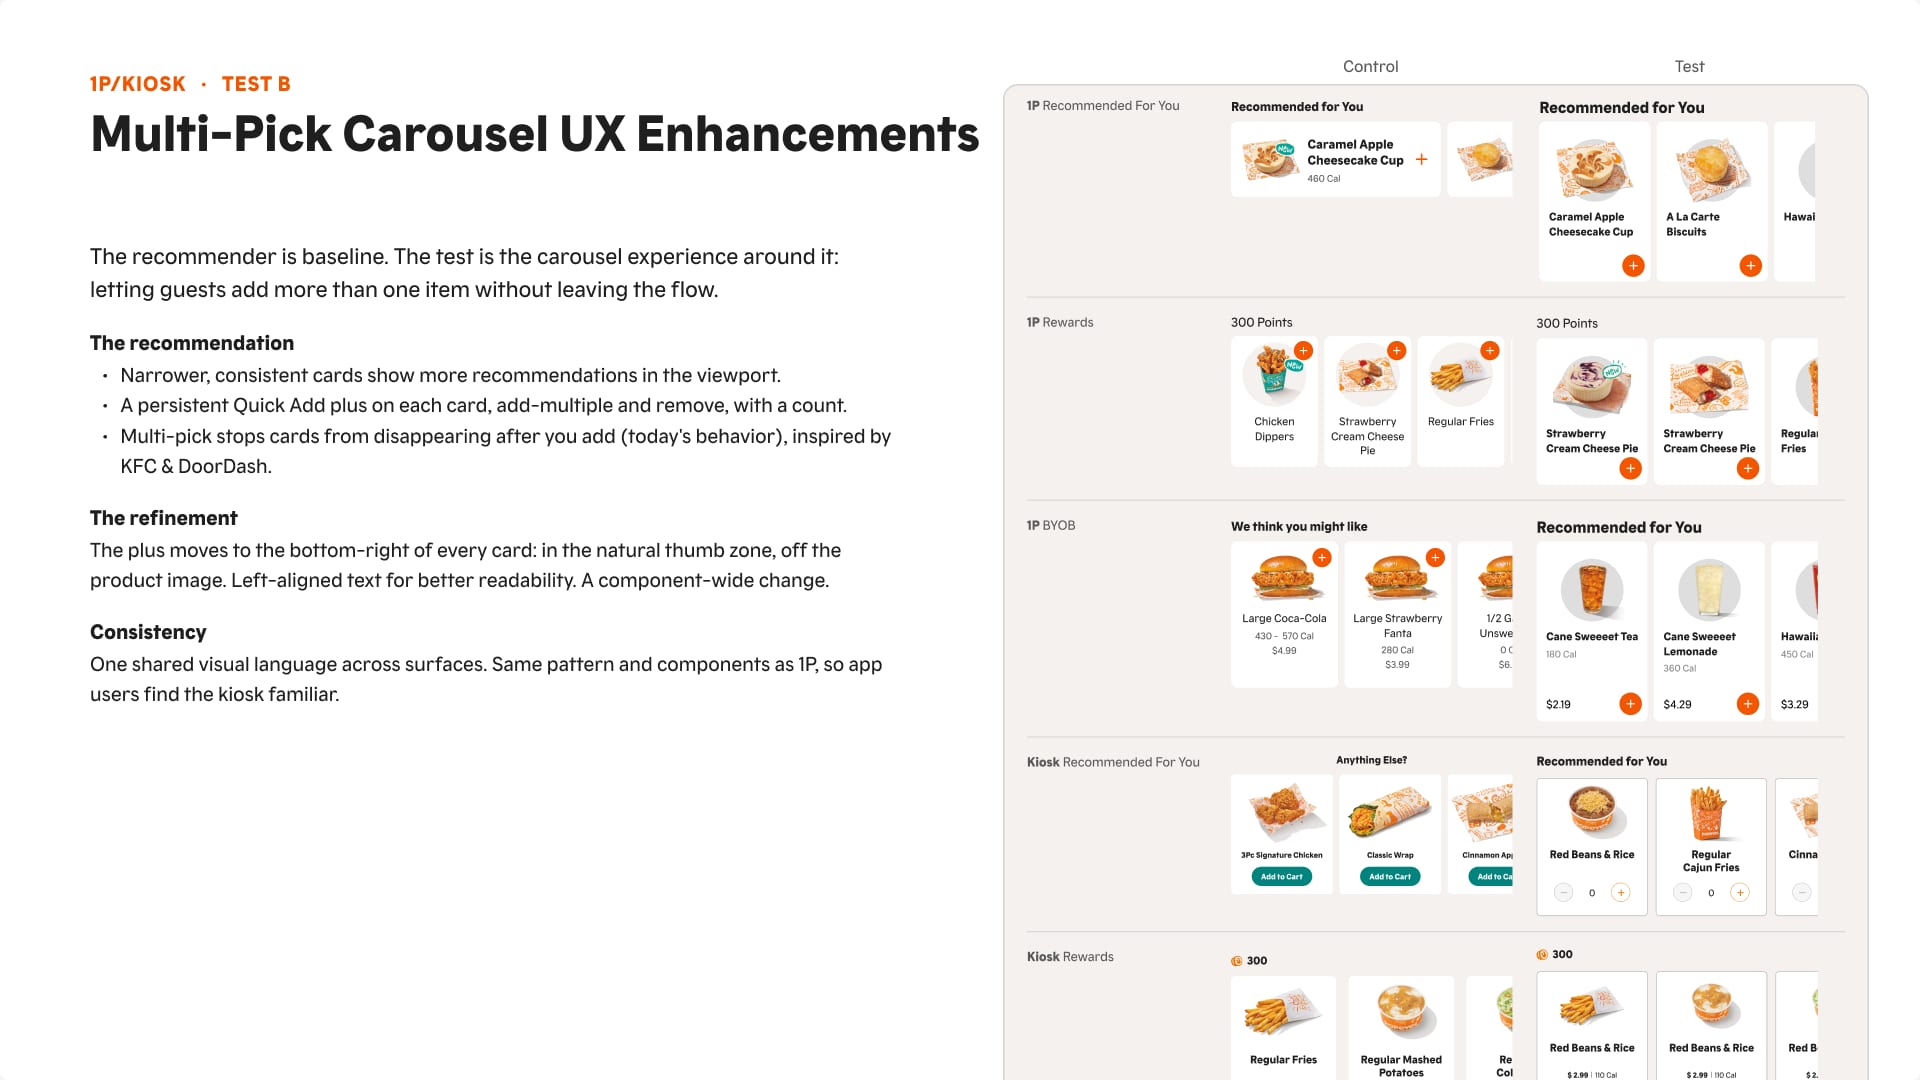
Compare what people say with what they do. Say so when the test setup fails. And read results against total sales, not just upsells.
A kiosk menu guests can find their way through, tested with a three-version coded prototype and two rounds of multi-cohort testing.
or see all 20 projects